In mid-2017, A&F Co. transitioned to a more stringent auditing and grading system, allowing the reporting of more detailed audit results. As of the 2018 audit cycle, we can now identify the most common findings for each category throughout the audited factory base in a consistent and transparent manner, as well as share steps being taken to address those issues. Metrics below reflect the 2024 fiscal year.
Audit Highlights
453
Audits Completed
99%
Transparent Factories
100%
Tier 1 Logoed Factories Audited
Key Findings

100%
69%
100%
99%*
99%**
99%***
2
0
Active Factory Ratings
66%
A + B Rating
43%
A Rating
22%
B Rating
22%
C Rating
11%
D Rating
2%
F Rating
*One factory had unauthorized production in 2024. Policies were recommunicated to the vendor and factory to ensure transparency and trust going forward.
**One factory identified issues of instances where workers paid supervisors to get the job, which violates A&F Co.’s zero recruitment fee policy. To remediate this matter, the factory reimbursed the workers and the supervisors were dismissed by following proper discipline procedures.
***Four factory audits identified that supervisors shouted at workers using improper tone and language. These factories have been required to complete training on supervisory skills and strengthen grievance mechanisms and resolution processes.
Historial Audit Data
Factory Metrics and Goals
A&F Co. partners closely with our vendors to assess and remedy findings found during the audit. Findings from past years all have created corrective action plans.
Transparency in our audit process allows auditors to properly review wages, benefits, insurance and working hours to ensure the factory is following legal and A&F Co. Vendor Code of Conduct requirements. To improve transparency and achieve full accountability, A&F Co.’s sustainability team communicates with all vendors on A&F Co.’s transparency expectations during audits. Factories with non-transparency issue will enroll to our Remediation Program. A&F Co. will terminate relationships with vendors if no meaningful improvement is made.
A&F Co.’s data and metrics behind this commitment are tracked in two areas:
-
Labor and Social Standards
Ensure that people in our supply chain are treated with dignity and respect.
-
Health and Safety
Ensure that our Supply Chain Partners operate in a manner which is aligned with A&F Co.’s principles and values.
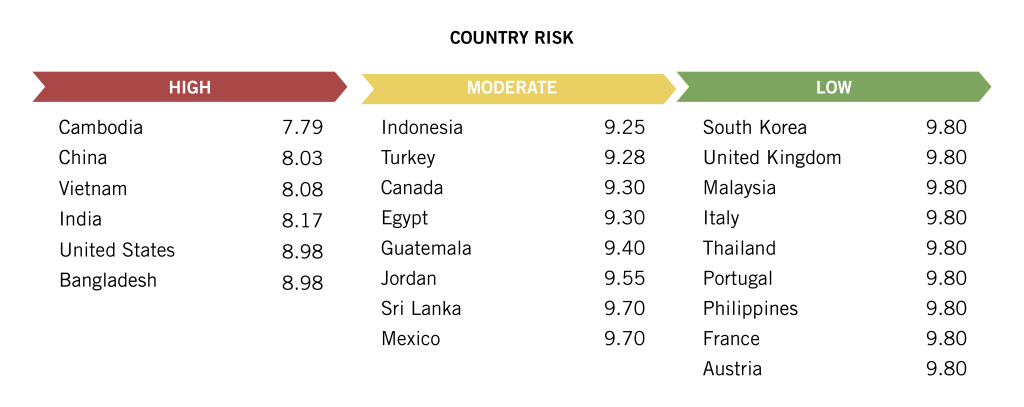
Country Risk
Using the following High Risk Categories, we have developed a “Country Risk Score” for each country our suppliers operate in. Each category is assigned a score (out of 10) based on the proportion of Tier 1 and 3 factories that are non-compliant in each ‘high risk’ category. Countries with a lower score, are considered high risk as they have more non-compliant factories in our high risk categories. More metrics on high risk factors can be found above.
The Country Risk Score takes into account the number of active factories in each country our suppliers operate in*. This metric allows us to focus our efforts in countries where our suppliers are more present.
High Risk Categories: Transparency, Harassment & Abuse, Child Labor, Migrant Labor, Forced Labor, Wages
Below reflects the risk score for fiscal year 2024.
*There is no direct correlation between A&F Co. sourcing volume and the number of factories in each country.